


 Download PDF
 Cite this report
Introduction
A wholesale price is the least examined number in ecommerce, and the margin it leaves behind is worse. This report is for anyone who needs a defensible one: a reseller deciding what to stock, an analyst building a model, a journalist checking a claim before it goes to print. Two figures dominate the topic, and neither carries a source. One says keystone pricing means doubling cost. The other says wholesalers make 15 to 20 percent. They appear across hundreds of pages with no methodology, no sample and no measurement between them, and they are wrong in opposite directions. There are two margins stacked between the factory and the shopper, and most published writing on this subject quietly conflates them.
This page rebuilds the answer from federal statistics first. Where federal data stops, and it stops earlier than most people assume, named industry research with a disclosed sample takes over, and its limits are stated alongside its findings. Two costs that belong in any full accounting (advertising and shipping) have no published benchmark that meets this standard, so they are named as gaps rather than estimated. The page is reviewed quarterly and rebuilt annually as the underlying releases land.
Is keystone pricing still real, or is 2x cost just a number people repeat?
Start with the structural point most writing on this topic skips. There are two margins between the factory and the shopper, not one. The wholesaler buys from a manufacturer and sells to a retailer, keeping a margin. The retailer buys from the wholesaler and sells to the public, keeping a second margin. Keystone pricing has only ever described the second one.
Keystone implies a 50.0% retail gross margin, and no line of US retail trade reaches it. Retail as a whole ran 34.2%. Electronic shopping and mail-order houses, the closest thing federal statistics have to online retail, ran 45.7%, the highest of any major retail line and still five points short of the folk rule. One rung up the chain, merchant wholesalers cleared 26.2%. So the doubling rule overstates the retail rung, and the "15 to 20 percent" claim understates the wholesale one.
Some definitions, once, because a large low-difficulty search cluster is people asking what these words mean. The wholesale price is what a supplier charges a buyer purchasing for resale. The retail price is what the end customer pays. Each party's gross margin is the gap between what it paid and what it charged, as a share of what it charged. MSRP is the manufacturer's suggested retail price, a number the supplier states and nobody is obliged to honor.
Then the distinction that quietly wrecks most published estimates. Markup and margin are not the same number. Doubling cost is a 100% markup and a 50% margin, and the two get quoted onward as though they were interchangeable. That is how a claim about markup becomes a claim about margin somewhere between the source and the reader, and it inflates every folk estimate in circulation.
| 50.0% | retail gross margin implied by keystone pricing (2x cost) |
| 45.7% | electronic shopping and mail-order houses, actual |
| 34.2% | all US retail trade, actual |
| 26.2% | US merchant wholesalers, actual |
Which product categories actually carry margin in 2026?
The average is close to meaningless. Published wholesale gross margins run from 41.4% at the top of the consumer categories down to 14.4% at the bottom, and the categories at each end are ones a reseller would recognize on sight. Clothing and accessories sits at the top. General line grocery sits at the bottom. A single average wholesale price figure spanning that range describes nothing in particular.
Read the table for what it is. These are the margins wholesalers realized on their own sales, not the margins a reseller earns buying from them. No public source publishes reseller margin by consumer product category, which is the single largest hole in this subject. What the wholesaler's number does show is where the money already sits in the chain, and which categories are structurally thin before anyone downstream takes a cent.
Six-digit industry detail from the Economic Census, released in July 2025, is the deepest free category data on wholesale margins by industry available anywhere. It is not product-level, and the Economic Census runs on a five-year cycle, but it measures what a wholesaler actually realized rather than what anyone thinks they should charge.
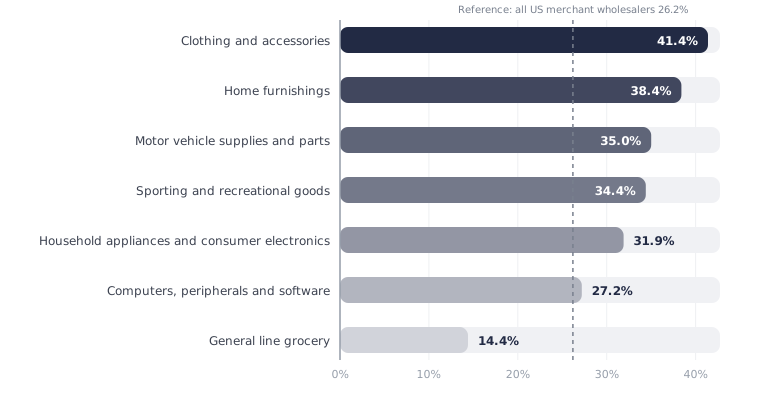
The published high across every wholesale line, consumer or not, is medical, dental and hospital equipment at 45.1%, which is not a category most resellers can enter.
Now the part that goes unwritten. Census withholds the margin figures for jewelry, watches, precious stones and precious metals (6,904 establishments), for toy and hobby goods, and for footwear. All three carry the disclosure flag D, defined by Census as "withheld to avoid disclosing data for individual companies." Three categories resellers search heavily have no published federal margin figure at all. Any page showing a US gross margin for jewelry or toys or shoes did not get it from the government, and it is worth asking where it did come from.
One boundary marker, because it gets crossed constantly. Listed US apparel companies ran a 56.88% gross margin in January 2026, across a 35-company group. That is branded-apparel economics: businesses that own their design, their marketing and their pricing power. A reseller buying finished goods from a wholesaler is not in that business, and public-company margins are a ceiling here rather than a target. For which specific products carry margin, rather than what margin a category carries, see SaleHoo's list of low-cost products with high profit margins.
What does a reseller actually keep after fees, shipping and returns?
Gross margin gets published constantly. The number underneath it almost never does, and the reason is that the number underneath it is uncomfortable.
Ecommerce stores averaged a 49.5% gross margin and a 10.6% net profit margin in 2026. Those figures come from 300 store owners representing $3.5 billion in combined revenue, and the publisher describes the pairing as the highest gross margins it has ever recorded against the lowest net margins. Channel matters inside that average: stores selling mainly direct to consumer averaged 52.7% gross, stores selling mainly on Amazon averaged 41.9%. And 53% of owners take a modest salary or nothing at all, which is the part of the ladder no margin figure captures.
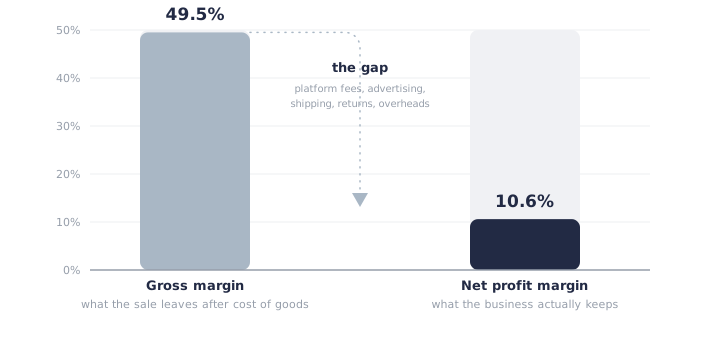
The cost stack is documented line by line, and every rate below is published by the platform charging it. Amazon's referral fee is 15% for home and kitchen, sports and outdoors, toys and games, and pet supplies. Clothing above $20 pays 17%. Jewelry pays 20% on the first $250. Consumer electronics pays 8%. The Professional selling plan costs $39.99 a month, and Amazon's 2026 schedule, effective 15 January 2026, held referral fees flat while raising fulfillment fees by an average of $0.08 per unit. eBay takes 13.6% up to $7,500, plus $0.40 an order above $10 and $0.30 at or below. PayPal's rate card, updated 15 July 2026, charges 3.49% plus $0.49. Stripe and Shopify Payments start at 2.9% plus $0.30.
Then returns, which sit outside the fee schedule and hit the same line. An estimated 19.3% of online sales value was returned in 2025 (f), against total US retail returns across all channels of $849.9 billion (f), of which 9% are fraudulent. Take sporting and recreational goods, where the wholesaler realized 34.4%. A seller in that category pays 15% on the sale price to Amazon, roughly three percent again in card processing, and watches close to a fifth of sales value come back. The ecommerce profit margin left over is thin enough that pricing off the gross figure is a mistake, not optimism.
Two components are missing from that stack, and they are missing on purpose. No source with a disclosed sample publishes an average advertising cost of sale for sellers, and none publishes an average shipping cost per order. The figures that circulate for both trace to vendor material with no sample and no methodology, and the small number of credible attempts sit behind registration walls. So the real take-home sits below the ladder above, by an amount nobody has published.
Are wholesale margins narrowing, and who is absorbing it?
Before the answer, the caveat, because this is the single easiest way to get wholesale margin writing wrong. The Bureau of Labor Statistics measures wholesale trade output as margins and publishes it as an index, not a level. The index can say the margin moved. It cannot say grocery wholesalers earn 14 percent, and a fair amount of published writing treats it as though it can. The durable and nondurable series also run on different base periods, so their index levels cannot be compared with each other either. Only their direction.
The durable-goods margin index is at its highest point in the series. The nondurable index is not.
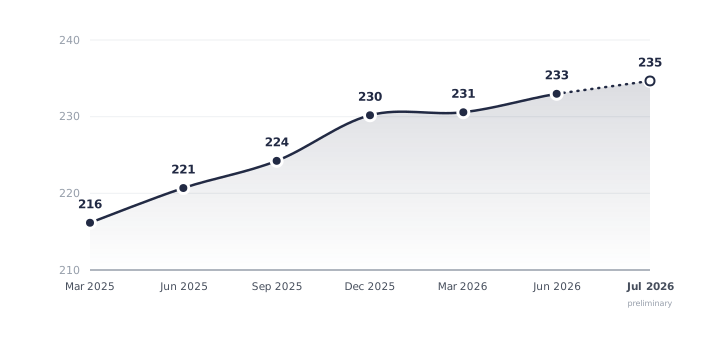
The nondurable side turned first, and it is the larger half of the sector by sales. Its index set a record in June 2026 and fell 1.7% in July. Durable rose 0.7% in the same month. So one half of wholesale trade is still setting records and the other has just rolled over, and nondurable is where grocery, drugs and petroleum sit.
A second federal source points the same way. Wholesale trade corporations reported $25.1 billion in after-tax profits in the first quarter of 2026, on unadjusted sales of $1,003.6 billion, against $18.8 billion on $900.4 billion a year earlier. Profits grew faster than sales. That series covers corporations with assets of $50 million and over, so it describes large wholesalers rather than the whole universe, and it measures profit rather than margin. Two independent federal measures moving together is still worth more than either alone.
Two caveats on reading the chart. The index is nominal and has climbed through a period of high goods inflation, so a wholesaler capturing more dollars of margin per unit is not the same as one capturing a wider percentage of the sale price. And the index tracks what wholesalers capture, not what their customers keep. A rising wholesale margin index and a squeezed reseller are entirely compatible. For the quarterly version of this question, see the Dropshipping Price Index.
How many small sellers actually hit their category's margin benchmark?
The category benchmark is a target most sellers never reach, and the distribution is more useful than any average.
Note the sample before quoting it. Two billion dollars across 181 sellers averages roughly $11 million each, so this describes established operators rather than a first-year store. Which makes the result harder to dismiss, not easier. These are the sellers with the scale, the buying power and the ad budgets to defend a margin, and more than a third of them are not growing at all.
Concentration is the other half of the picture, and it moved fast. Fewer than 8,000 sellers now generate half of Amazon's estimated $300 billion in US third-party sales, which is 1.6% of an active base of roughly 500,000 sellers. Three years earlier it took 15,000 sellers to reach the same halfway mark. The top cohort's average revenue nearly doubled over that period. So the median seller is competing inside a market where the revenue is consolidating upward while margin pressure spreads downward.
Set the two halves of this report against each other carefully, because the temptation is to set them against each other carelessly. A clothing wholesaler realized 41.4% gross. Ecommerce stores averaged 10.6% net. Those are different measures, at different rungs of the chain, on different populations, and the comparison proves nothing on its own. What it does show is how far apart the two numbers a seller encounters really are. The benchmark quoted in most sourcing advice is a gross figure from somewhere upstream. The figure that reaches a bank account is a net one at the bottom. Between them sit platform fees, payment processing, returns and the two costs nobody has published.
Conclusion
Three things the data says flatly.
The two margin figures in widest circulation have no source. Not a weak source or an old one. They carry no sample, no methodology and no measurement, and they are wrong in opposite directions: the doubling rule overstates the retail rung, and "15 to 20 percent" understates the wholesale one.
Category dispersion is wider than any average can carry. Inside one federal dataset, consumer wholesale categories run from 41.4% to 14.4%, and three of the categories resellers ask about most are withheld entirely.
Gross margin and take-home margin are far enough apart that most sellers are pricing off the wrong one. Across 300 ecommerce stores in 2026, a 49.5% gross margin became a 10.6% net one, and more than half of those owners paid themselves a modest salary or nothing.